Polynomials and their graphs
Students work with expressions that have powers like x squared and x cubed. They add, multiply, and factor these expressions, then sketch the curves and find where the curves cross zero.
This is the year math stretches past straight lines into curves, waves, and growth that bends. Students work with polynomial, rational, exponential, and logarithmic equations, and meet trigonometry as the math behind anything that repeats, like sound or seasons. Statistics gets more serious, with students using a sample to make a careful guess about a much larger group. By spring, students can sketch a curve from its equation and explain what its shape says about a real situation.
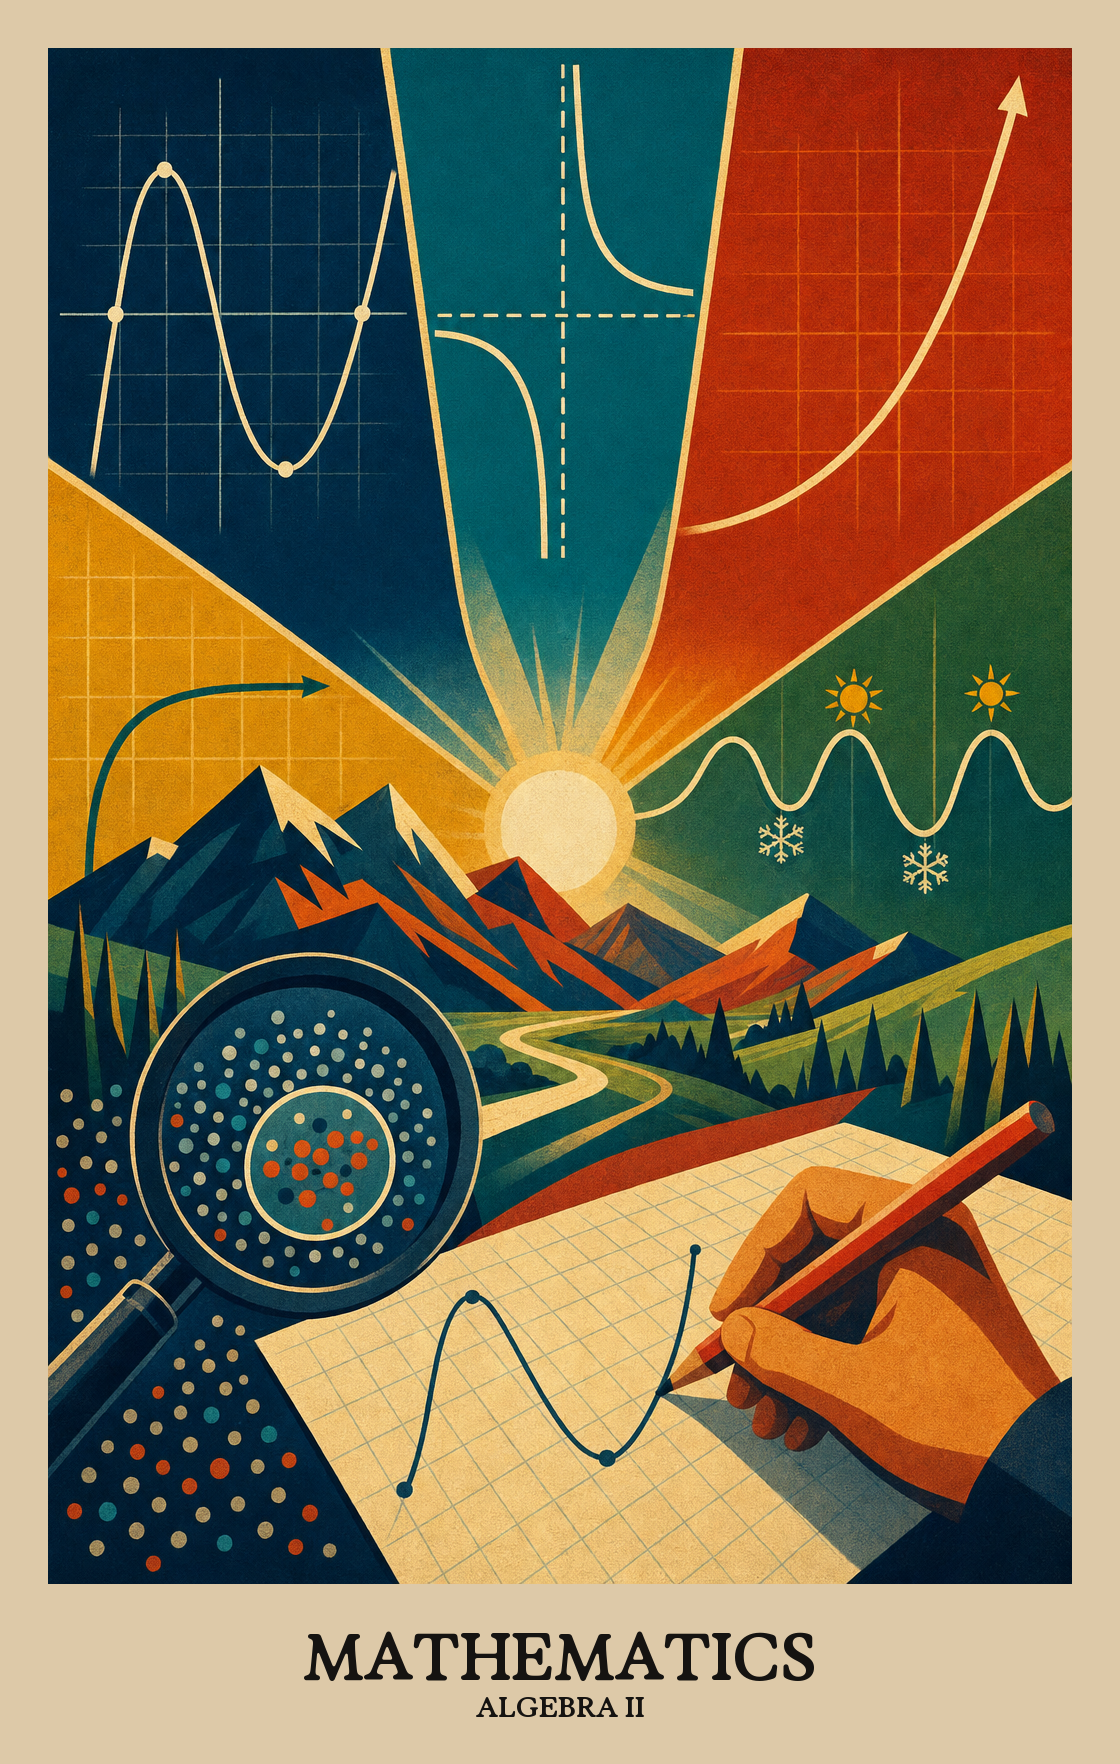
Students work with expressions that have powers like x squared and x cubed. They add, multiply, and factor these expressions, then sketch the curves and find where the curves cross zero.
Students handle fractions that have variables on the top and bottom. They simplify these expressions, solve equations that include them, and learn which answers are real and which ones break the rule of dividing by zero.
Students study patterns that grow or shrink quickly, like money in a savings account or a population over time. They learn how logarithms undo exponents and use both to answer real questions about growth and decay.
Students use sine and cosine to describe things that repeat, like daylight hours across a year or a wave on a string. They graph these patterns and use identities to rewrite expressions in simpler forms.
Students use data from a small group to make careful claims about a larger one. They look at how surveys and experiments are designed and judge when a conclusion is solid and when it is shaky.
Students read a math problem carefully, figure out what it's actually asking, and keep working through it even when the first approach doesn't pan out.
Students take a real problem, strip it down to symbols and equations to solve it, then translate the answer back into what it means in the original situation.
Students back up their math conclusions with logical steps and real examples, then explain why a classmate's approach works or where it breaks down.
Students take a real situation, like figuring out loan payments or comparing phone plans, and write an equation or draw a graph to make sense of it. Math becomes a tool for answering questions that actually come up outside school.
Students choose the right tool for the problem, whether that means a graphing calculator, a quick estimate, or working it out by hand. The goal is knowing when each approach actually helps.
Students use exact math vocabulary and keep units consistent when setting up and solving problems. A missing label or loose wording can change what an answer actually means.
Students spot repeating patterns or hidden shapes inside equations and expressions, then use those patterns as shortcuts for solving problems. Recognizing structure saves steps and makes complex algebra feel predictable.
Students notice when the same steps keep appearing in a problem and use that pattern as a shortcut or rule. Instead of solving from scratch each time, they generalize what they've already figured out.
| Standard | Definition | Code |
|---|---|---|
| Make Sense of Problems Algebra II | Students read a math problem carefully, figure out what it's actually asking, and keep working through it even when the first approach doesn't pan out. | DE-MATH.MP.hs-algebra-2.1 |
| Reason Abstractly Algebra II | Students take a real problem, strip it down to symbols and equations to solve it, then translate the answer back into what it means in the original situation. | DE-MATH.MP.hs-algebra-2.2 |
| Construct Arguments Algebra II | Students back up their math conclusions with logical steps and real examples, then explain why a classmate's approach works or where it breaks down. | DE-MATH.MP.hs-algebra-2.3 |
| Model with Mathematics Algebra II | Students take a real situation, like figuring out loan payments or comparing phone plans, and write an equation or draw a graph to make sense of it. Math becomes a tool for answering questions that actually come up outside school. | DE-MATH.MP.hs-algebra-2.4 |
| Use Tools Strategically Algebra II | Students choose the right tool for the problem, whether that means a graphing calculator, a quick estimate, or working it out by hand. The goal is knowing when each approach actually helps. | DE-MATH.MP.hs-algebra-2.5 |
| Attend to Precision Algebra II | Students use exact math vocabulary and keep units consistent when setting up and solving problems. A missing label or loose wording can change what an answer actually means. | DE-MATH.MP.hs-algebra-2.6 |
| Use Structure Algebra II | Students spot repeating patterns or hidden shapes inside equations and expressions, then use those patterns as shortcuts for solving problems. Recognizing structure saves steps and makes complex algebra feel predictable. | DE-MATH.MP.hs-algebra-2.7 |
| Express Regularity Algebra II | Students notice when the same steps keep appearing in a problem and use that pattern as a shortcut or rule. Instead of solving from scratch each time, they generalize what they've already figured out. | DE-MATH.MP.hs-algebra-2.8 |
Students read graphs of advanced functions, including curves that model growth, decay, and wave patterns, to identify key features like peaks, valleys, and where the graph crosses zero.
Students add, subtract, multiply, and divide expressions with variables raised to powers, then solve equations built from those expressions. This is the algebra behind graphing curves and modeling real-world relationships.
Students use sine, cosine, and related functions to describe patterns that repeat on a regular cycle, like sound waves, tides, or a spinning wheel. They practice matching the right equation to real data that rises and falls in a predictable rhythm.
Students use data collected from a sample group to draw conclusions about a larger population. They apply statistical reasoning to decide what the data suggests and how confident they can be in that conclusion.
| Standard | Definition | Code |
|---|---|---|
| Functions and Graphs Algebra II | Students read graphs of advanced functions, including curves that model growth, decay, and wave patterns, to identify key features like peaks, valleys, and where the graph crosses zero. | DE-MATH.A2.hs-algebra-2.1 |
| Polynomial and Rational Algebra II | Students add, subtract, multiply, and divide expressions with variables raised to powers, then solve equations built from those expressions. This is the algebra behind graphing curves and modeling real-world relationships. | DE-MATH.A2.hs-algebra-2.2 |
| Trigonometry Algebra II | Students use sine, cosine, and related functions to describe patterns that repeat on a regular cycle, like sound waves, tides, or a spinning wheel. They practice matching the right equation to real data that rises and falls in a predictable rhythm. | DE-MATH.A2.hs-algebra-2.3 |
| Statistics and Probability Algebra II | Students use data collected from a sample group to draw conclusions about a larger population. They apply statistical reasoning to decide what the data suggests and how confident they can be in that conclusion. | DE-MATH.A2.hs-algebra-2.4 |
Federally administered sample-based assessment in reading, mathematics, science, and writing. NAEP results inform state-by-state comparisons rather than individual student or school accountability.
Students work with bigger families of functions: polynomials, rational expressions, exponentials, logarithms, and trigonometry. They graph these functions, solve equations that use them, and use them to describe real situations like growth, decay, and repeating patterns. The year ends with a unit on statistics and drawing conclusions from samples.
Ask them to show you the problem and explain what they have already tried. Most stuck moments come from a small slip in algebra or a missed step, not a missing big idea. Suggest they sketch a quick graph or plug in a number to test their work, then walk through it with them out loud.
Graphs are how students see what a function is doing. By looking at a curve, they can spot where it crosses zero, where it grows fast, and where it repeats. Reading a graph well is one of the main skills colleges and workplaces expect from this course.
A common path is polynomials first, then rational functions, then exponentials and logarithms as inverses, then trigonometry, with statistics at the end. Building from polynomial structure into rational expressions lets students reuse factoring and end behavior. Saving trigonometry for later gives time to connect it to periodic models.
Factoring higher-degree polynomials, working with rational expressions, and the rules of logarithms tend to need the most cycles. Many students also need extra time on the unit circle and on reading the period and amplitude of a trig graph. Plan a short review block before each assessment instead of one big push at the end.
The specific equations may not come up again, but the habits will. Algebra II is where students practice breaking a messy problem into parts, checking answers for sense, and using a model to make a prediction. Those habits show up in science classes, trades, finance, and most college majors.
Students should move between an equation, a table, a graph, and a word problem for each function family without getting lost. They should solve polynomial and rational equations cleanly, use logs to undo exponentials, and read a sine or cosine graph. They should also draw a reasonable conclusion from sample data.
Ask them to graph a function by hand and explain what each part of the equation does to the graph. If they can do that for a polynomial, an exponential, and a sine function, and solve a word problem with units that make sense, they are in good shape. Shaky work in any of those areas is worth a summer review.
Technology is the right tool for checking work, exploring a new function, and handling messy numbers. It is the wrong tool for skipping the algebra that builds fluency. A good rule is to do the first few problems of a skill by hand, then bring in the calculator once the method is clear.